The research function for DFSX let’s you do research on Players or Teams.
Research Teams

The Research Teams option provides insights into the generic team data including win / loss, Average Points Per Game, Opponents Average Points Per Game, The Leagues Average Points Per Game, and other team-based information.
Research Players

When you research players you can pick 3 different functionalities on the Research Players window:
- Probabilities
- Compare Players
- Player History
Research Players >Probabilities

This analytical tool presents you the probability of a given player, within the universe of the other chosen players, ranking within the top 25%, 50% and 75% of those selected players. Please realize that this same data is available, in graphical format, in the charting functions. Also, within the data presented here, you are provided the projected performance of each player. What you will notice, as you hit “Run Simulations” over and over is that there can be a relatively wide range in the predicted performance of a given player, yet, they still remain in the same position in terms of ranking probability. This may seem incongruous, however, if you also look at the projected ceiling and floor for the given player, you’ll see that within the presented range, players with high ranking probabilities will also have higher ceilings and floors.
Feel free to hit the “Run Simulations” button over and over to get a decent feeling of a given players expected performance.
How are probabilities calculated? (Stick with me here) For each chosen player, StatShark takes the median performance of the chosen metric (i.e., DFS Points) and the player’s standard deviation (variability) of performance and fabricates 10,000 samples where a random number is generated between the median and +/- x standard deviations (the variability limits) within an inverse normal distribution of the given range (which is a fancy way of saying that StatShark knows most of the random numbers should clump around the median). For each of the 10,000 iterations StatShark ranks each player’s performance across the other chosen players (i.e., more points indicate better rank). StatShark then look at each player’s rank and determines if it was within the top 25% of the chosen players, top 50% and top 75%. For each player, StatShark count how many times, out of 10,000 iterations, they hit each of those benchmarks (top 25%, 50%, 75%). After completing 10,000 iterations for each player StatShark then takes each player’s count for hitting each of those benchmarks and divides by 10,000. So, for example, if a player’s simulated outcome, using random variability, ranked in the top 25% of the chosen players, 5,000 times, and StatShark divides those 5,000 occurrences by 10,000 attempts. So, 5,000 divided by 10,000 is 0.50, or 50%. Thus, the likelihood of given player being in the top 25% of the chosen players is 50%. Of course, that’s better than a player who has only a 30% chance of being in the top 25% of those players.
Think of it this way… in school you get all A’s in every class with no variability; A, A, A, A… What’s the likelihood of you graduating in the top 5% of your class? Just about 100%.
Research Players > Compare Players

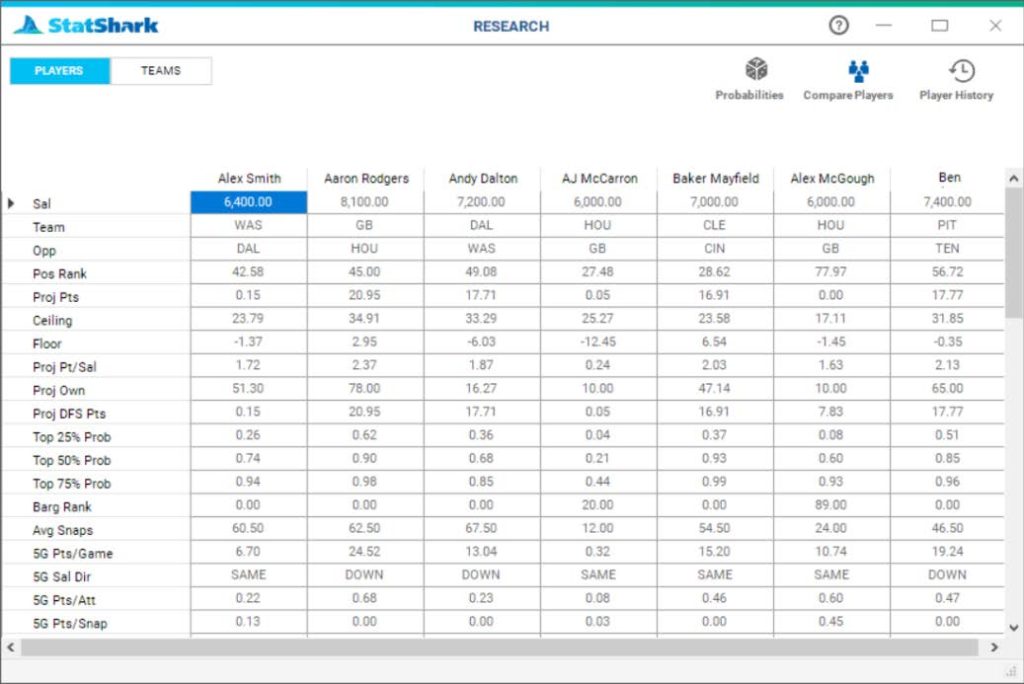
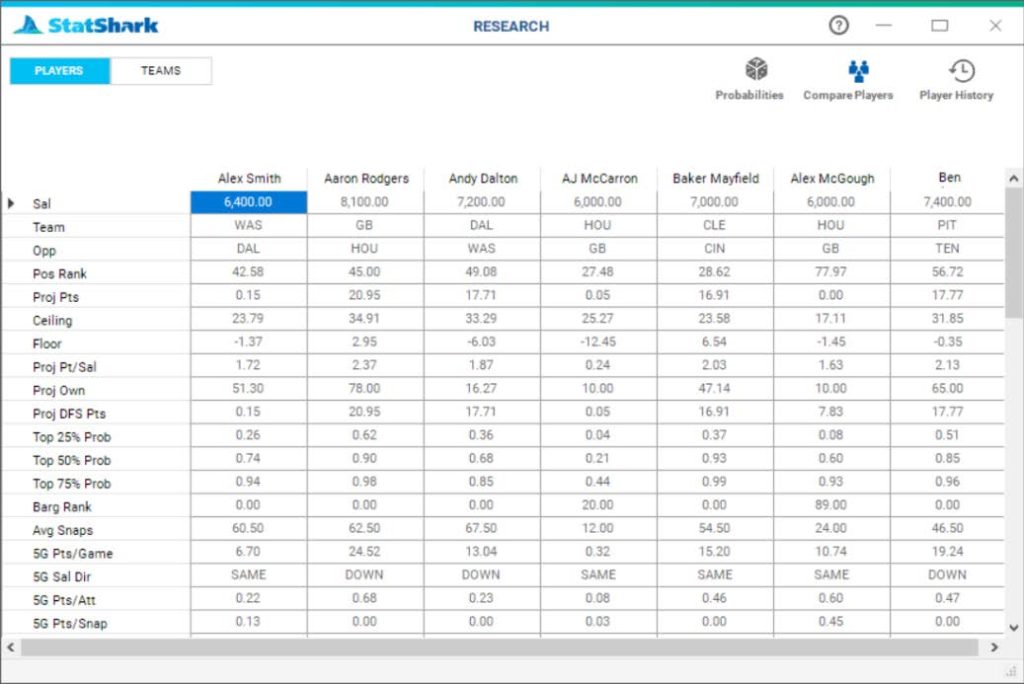
The Compare Players analytical tool provides you a head-to-head layout of players you have chosen to compare.
Research Players > Player History

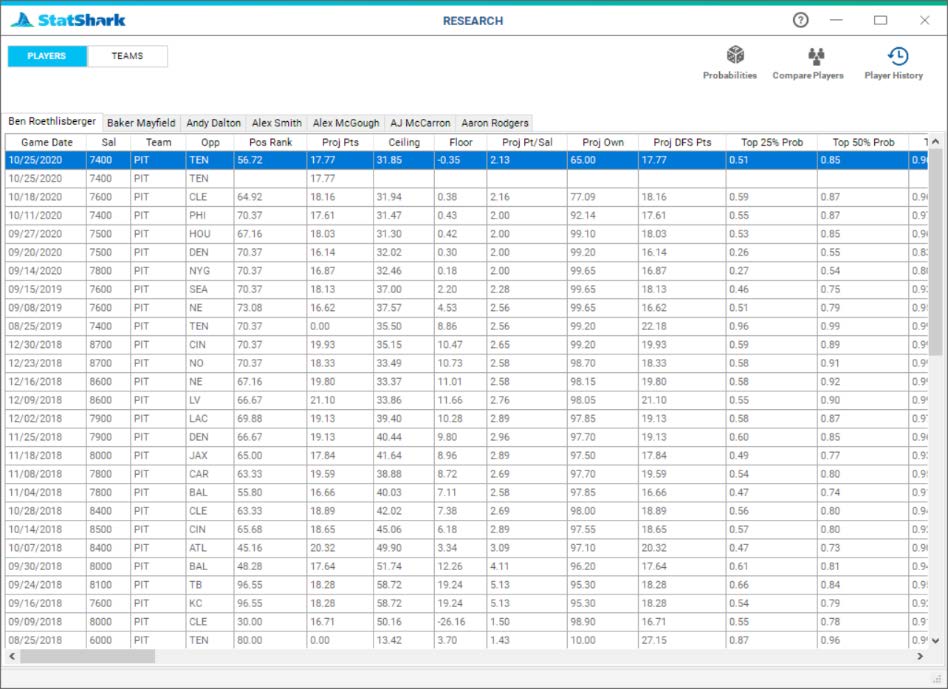
The Player History tool provides you the full history of all players you have selected, in tabbed sections. So, like a spreadsheet, each player will be given his own tab, and within that tab, all historical data available for that player will be presented. The default sorting is by date, however, you can sort by any of the fields shown.